There are a lot of LEAN tools available to reduce or eliminate various types of waste existing in a process/system. Transportation, Motion and Waiting time are some types of waste that exist commonly in every process or operation irrespective of the nature of work.
Spaghetti Diagram is a tool (Part of LEAN Tools) that helps to reduce the waste on transportation, motion and waiting time. It works on the physical layout of a process to achieve its goal. Spaghetti Diagram may look like a simple and not very important stuff, as many of us tend to ignore the importance of floor layout and motion in any operation. Most operations being computerized and not connected physically support our opinion.
But it is just an opinion and not a fact. The fact is that Spaghetti Diagram tracks the movement of products, papers and even people. Thus it is applicable and beneficial in non-manufacturing processes also and proves that the above opinion is not right.
Spaghetti Diagram is a visual representation of the physical flow of materials, papers and people through the tasks (or) activities of a process. It details the flow, distance and waiting time of the transportation of items in the process. It also traces the walking patterns of people, shuttling back and forth of materials between tasks and work stations.
It looks as messy and complicated like the dish ‘Spaghetti’, so the name Spaghetti diagram.
How to draw a spaghetti Diagram?
- Plot the physical process flow (Layout) on a paper by approximately scaling down the distance between tasks and desks.
- Now, team up the actual workers who use the system and ask them to draw
- The flow of materials, papers
- The walking pattern of people
- Waiting time and stoppages at different points
- All these should be drawn in different colors to distinguish the exact problem.
- The lines should be redrawn for every trip or every movement. The thicker the line, the more complex the process is. Care should be taken not to miss minute tasks, small trips and repeated motions.
The completed diagram looks like a real ‘Spaghetti’. It reveals all the inefficiencies of a layout in contributing towards a LEAN process.
How to use the diagram to improve the layout?
The most connected tasks should be placed as much as close to each other, as they are the most frequently used paths. The paths with longest distance and longest waiting time also should be relocated to reduce the distance.
Most of the solutions will appear when the tasks are arranged in ‘C’ shape, ‘U’ shape, Rectangular or Circular shape. Depending of the workflow, user can change and choose the appropriate shape. User can also arrive at a customized shape based on his requirement.
Project managers and Lean Six Sigma Experts should assist the team in arriving at an appropriate design. Then the team should simulate the process with the new layout, track the new paths, walking patterns, and waiting times and make necessary corrections.
The new Spaghetti Diagram will now look simpler and easily manageable. Let us illustrate this with an example.
Spaghetti Diagram for a Restaurant Kitchen
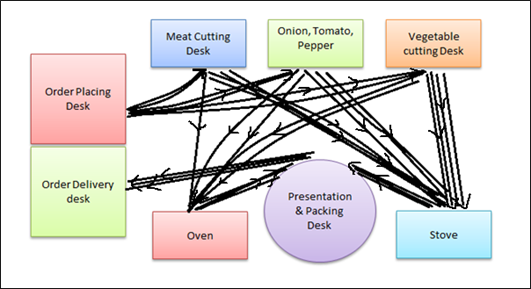
Assume a restaurant that cooks various types of food and serves based on orders taken. The management made a simple C shaped layout that makes all parts of the kitchen easily accessible to the chefs. But during peak hours however efficient and fast the chefs worked, there was a delay in the order delivery time. Often ingredients were confused and used in different dishes than intended, leading to customer dissatisfaction. Chefs felt unhappy and tired that irrespective of genuine efforts and mastery in cooking, the management was not happy and they felt every day was very hectic.
The management decided to use LEAN and process improvement techniques. One of the suggestions from the Process Excellence experts was to draw a Spaghetti diagram. The actual Spaghetti diagram of the order cooking process looked like this.
After seeing the Spaghetti Diagram, the team analyzed various combinations of process flow and arrived at the below Workflow.
Now it no longer looks like a Spaghetti diagram.
Benefits of a Spaghetti Diagram
Spaghetti Diagram helps in the following ways:
- It identifies inefficiencies in Area/Work layout.
- It helps in identifying the wastes of transportation, motion.
- It helps in reducing the Non value Added time spent in identifying missed products, confusion in order of processing items etc.
- It helps to improve the efficiency and reduce the fatigue of employees due to unnecessary movements.
- It identifies and works on the areas of Occupational safety.
Thus Spaghetti Diagram helps in marching towards a LEAN process.


