
Competitive advantage is a moving target. Where possible, it is always in an organization’s best interest to ensure that they are in the process of ensuring that all systems whether internal or external are involved in the process of optimization. Visual Management is one of those business management tools that will ensure that critical information is communicated to the workplace.
As humans, we are very visual in nature and as a result the Visual Management tool accomplishes the result of ensuring appropriate display of information, visual controls and other critical process tools that can be represented in a format that can readily be seen by the operational and management staff. As a tool for Lean Management, one can readily identify any process deviations from target since the tools will indicate what needs to be addressed. As long as the process status is visible to all, it will be possible for the critical action plans to be created that will enable a smooth running operation.
Industrial systems that have clearly identified issues in a visual format will enable the critical actions to be taken that will ensure the system itself is operating at an acceptable phase.
What are the tools of an effective visual management system?
For a visual management system to be effective, it is important for the organization to identify what the critical key performance indicators will be, and ensure that they are on display on a board that persons can see from a central position in the industrial plant. This location can include places like a control system that many persons will tend to traverse, or in a conference room where meetings are readily held and the system performance will be readily identified and displayed.
These critical operational tools include: operational parameters and even work instructions. With a clear indication what should be for the critical parameters at hand, it will be an element that will enable clear communication of how the system itself is actually performing. When deviations do appear, it will be possible for the appropriate changes to be made, in order to keep the system at peak. A visual system is one that will give a department pride in their work, because it will ensure that individuals will take the time to actually restore their systems if there’s a discrepancy. Where necessary, tools such as kaizens can then be incorporated into the operational practices just to ensure that continuous improvements are being adhered to.
An example of a visual system is shown below:
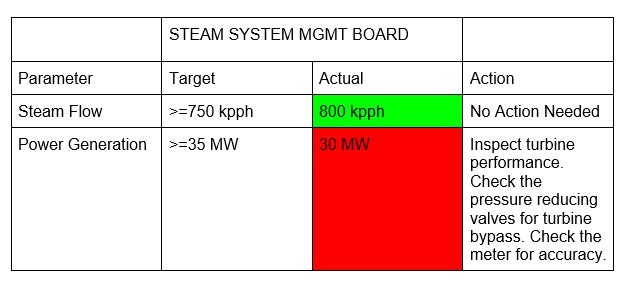
From the above example, you can clearly see the performance of the system that is currently being analyzed. From the first line of the table, you can see that this system is a system that is monitoring the performance of a steam management system. The department identified what the key performance indicators would be for this system.
Looking at the first parameter, you can see that the parameter that the system is monitoring is the Steam flow for a powerhouse. For a continuous process, there will be an identified steam flow, which you’ll see from the Target section of the table. The parameter indication for steam is identifying that the department wants to maximize its steam generation past a particular target point. The actual section is greater than the target, and the system is performing according to its target. At this point, the system can be deemed to be performing at target.
For the power generation parameter however, we notice a discrepancy. The target for the parameter is identifying that the power generation function is to be maximized past a particular point. The actual of the parameter is actually below target. From a Fishbone diagram, some initial troubleshooting of the process will identify that there are a few possibilities that are causing the system to perform below target. The possible causes are:
- Is the turbine operating as it should? Could it be scaled and in need of a turbine wash?
- Is adequate steam reaching the turbine, or are there pressure reducing valves open in the system that are causing a turbine bypass?
- Is the power meter recording the accurate value of steam generation?
A visual system clearly indicates a problem even before a detailed assessment is carried out. Without even reading, you’ll be readily drawn to the red item in the diagram and start intuitively figuring out why there’s an issue there. If anyone can readily read your system, you have done a good job of creating a Visual Management system that your operational staff will appreciate and utilize to regulate their maintenance activities.
Scientific studies do show proof that humans are indeed visual, and having tools that are able to meet these requirements will provide an environment that will generate quick action and change. Utilization of tools such as 5S that are able to show the visual organization of a space work quite well to organize jobs. Guide your operational staff to achieve the results that you desire. Visual Management is definitely the way to go. Research the various tools and identify the ones that will work for you.