The last phase of Six Sigma’s DMAIC model is the Control phase. The focus of this stage is to make sure that the action item created in the Improve phase is well-implemented and maintained. Several tools are used in this stage to make sure that variables are within its limits. Activities such as checking the proper execution of initiative(s), control charts are being employed, and effectiveness of the initiatives are also evaluated. To standardize the course of action and documents, the guidelines and the responsibilities are also shared with the proper group or individual.
Personnel who are directly affected by the project shall be trained and monitored as well.
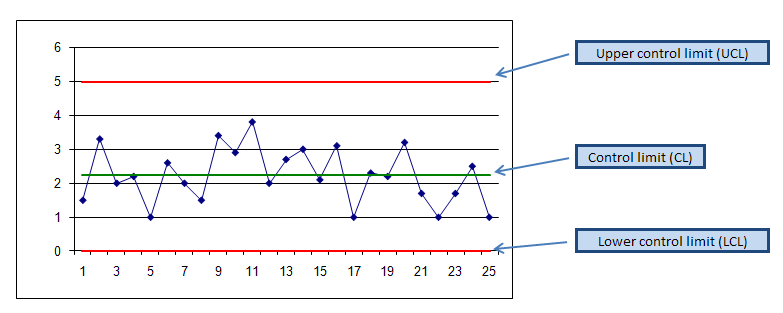
This phase uses several tools. The most common tool is the Control Chart. Project owners watch the progress of the process through the control chart. It is also a must that project owner can interpret the control chart so that the project team can create a reference log signifying what the project owner should look for. The charts are differentiated through the control limits set of three sigma from the course mean.

Control Chart
Process control is the carrying out of identifying and employing practical actions and measurements to make sure that the course meets the defined standards and requirements of the customer. In control phase statistical means are applied to the course in order to determine the unusual cause from a frequent cause of course variation. This is called statistical process control. This is done by plotting the figures over time and matching up to the results to the control limits.
The main reason of using control charts is to perceive the assignable causes of course variation so that examination and counteractive action will be carried out to eliminate the assignable causes of process discrepancy before there is an excessive number of conforming units produced or delivered services. This is also used for the sake of keeping the course within statistical control.
There are two classifications of data types. These are continuous data also called the variable data, and the discrete data. Examples of continuous data are currency, weight, time, temperature, and the like. Here, data is acquired is through measurement. This is characterized with no gaps amongst observations. Discrete data on the other hand, can be achieved through counting. Most of the time gaps are present. Examples are good or bad, yes or no, pass of fail, one or two.
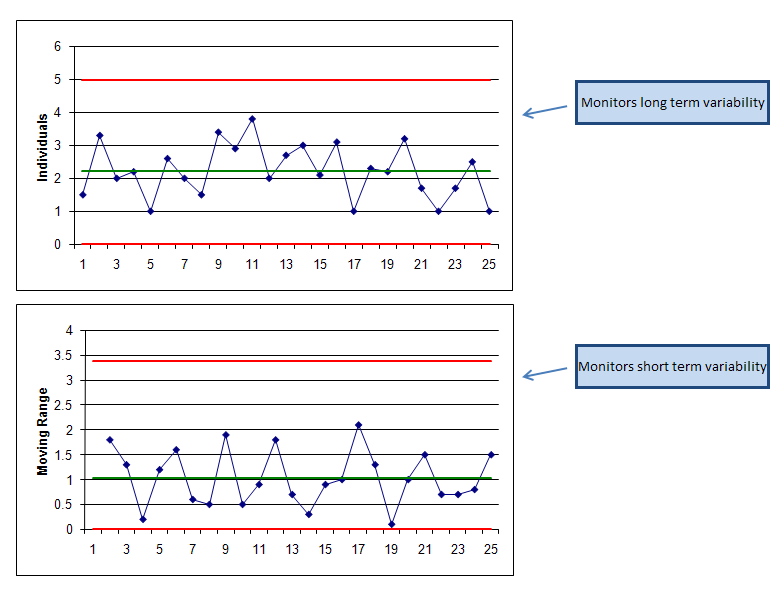
Example of variable chart is the I-MR chart. This is applied when only one capacity is taken on each sampling period. It has two charts: the Individual chart represented by I or X. This shows the actual capacity against sampling time. This is used to monitor the variability between two samplings. The Moving Range chart represented by MR presents the range value between the previous and the current sampling capacity against the sampling time. This is used to observe the unpredictability within the last two samplings.

Individuals and Moving Range
Trends should be reviewed periodically and should spot good change of process performance as shown on the control chart. If something similar is spotted and the reason is maintained in the current course, recalculate the control limits from the date the positive change was detected.
If process control involves carrying out of identifying and employing practical actions, Out of Control Action Plan refers to setting the plans in order to take action correctly to “out of control” signs. This can anticipate the course performance. Course changes are handled effectively and steadiness is ensured in the event of new conditions. This also allows early discovery of impending causes or problems before it becomes a problem.

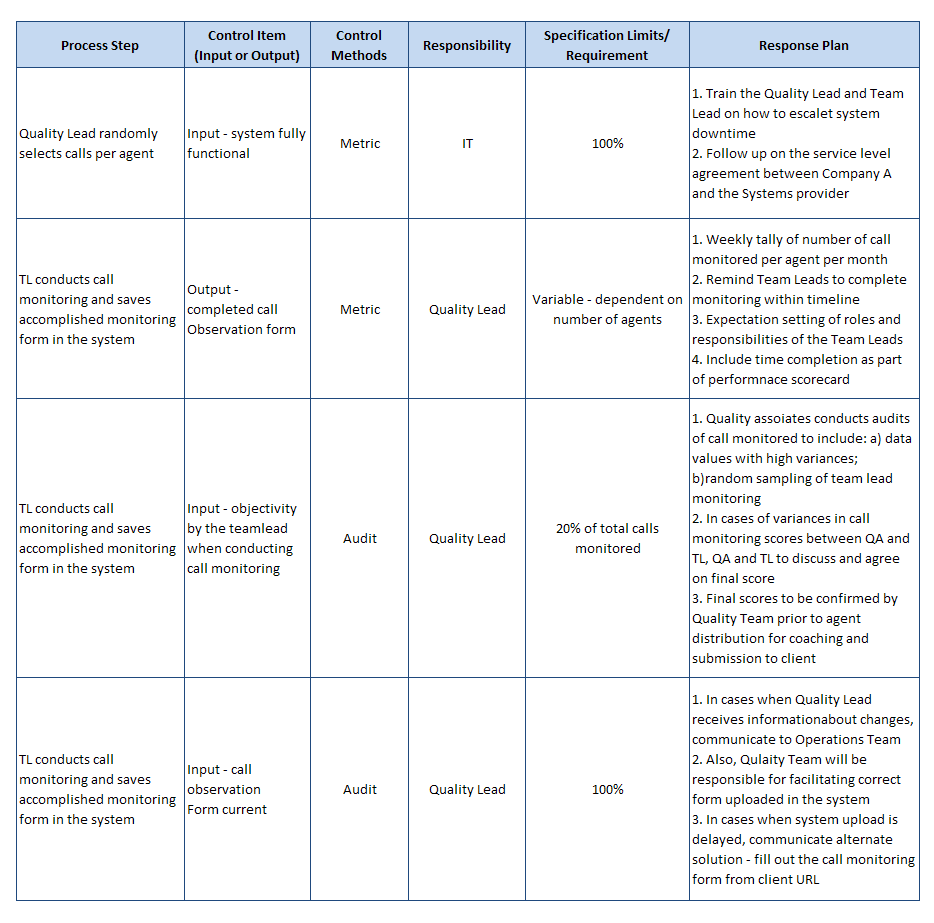
OCAP Table – Out of Control Action Plan Table
The table above is a draft of OCAP. The continuous procedure should be noted under the process step header. Control Item indicates the key course inputs that need to be managed to meet the production requirement. It should also include the key course outputs that need to be observed for signs requiring awareness. Control method should include control chart, metrics, after action reviews, approvals, and trainings. Responsibility notes the group or an individual who owns the job. Specification Limits/Requirements will show the customer measurement limits or requirements of the internal performance. Response plan should note the counteractive actions to solve/contain the problem and reduce losses. The table below shows an example of an OCAP:

OCAP Table Example
Control plans may include other data than the one presented. The important thing is that they must be available, controlled and trained to.
Visual Management is also another tool that can be used in Control phase. This shows the management of course performance by majorly displaying updated course standards, scorecards on performance, production goals, and other useful course and performance data in the work place. The objective of this tool is to drive the right behavior.
Examples of Visual Management are job aids posted on each work post, whiteboards showing daily progress against target, individual or team scorecards displayed in the team’s common area which can be the subject of discussion during team huddles.
Visual Management gives a real-time and clear line of sight to significant performance information. This also enables quick detection of performance concerns. Since this shown in a common area, this enables leads to deliver prompt response. VM also enables constant enhancement mindset that can determine chances for improvement.
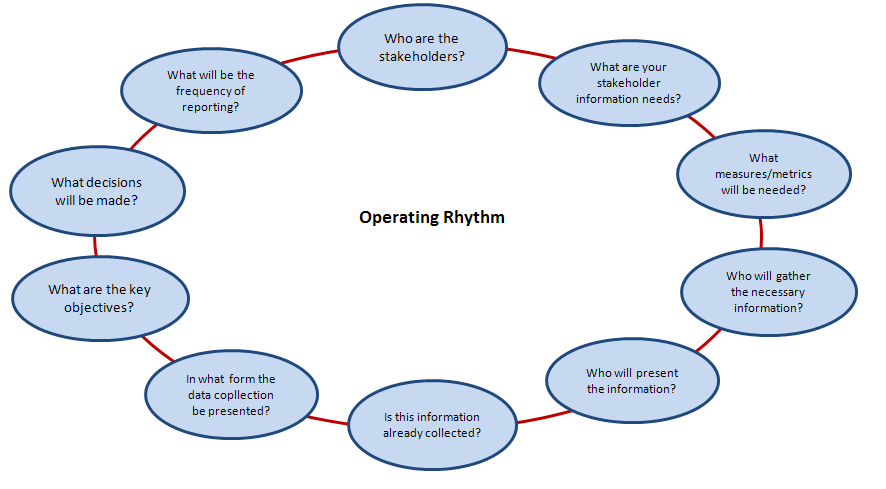
Another tool tat can be used during the Control phase is the Operating Rhythm. This is a set of structured, mutually dependent interactions that manages and shows performance information to allow stakeholder set to effectively, consistently, and proactively express control operations. It provides a shared and disciplined messaging method through which stakeholders are defined with roles, agendas, and outcomes.
Operating Rhythm holds rapid employment of tasks, messaging, and ideas through identified and prearranged interactions. It allows quick response and surfacing to process problems, self-esteem issues, and individual performance. Each communication has a stated objective, clear membership, set measures, designated leader, defined actions, and frequency. By connecting the suitable group members in a closely controlled structure, operations become dependent on process rather that dependent on individuals.

Operating Rhythm Chart
Productive assembly do not turn out by accident. There should be preparation, process, content, and follow-up. Operating Rhythm spans the entire organization thus it is imperative that everything, all factors, all aspects of the project is discussed.
