Below is an explanation of how the calculation is done, but if what you’re really looking for is just a calculator, you can use the one below, or get an extension for your browser: Firefox, Opera (Safari and Chrome coming soon). If you need support (or have feedback) with the calculator or any of the extensions, please use the commenting system at the end of this post.
| Defects: | |
| Sample size: | |
| DPM: | |
| Sigma: | |
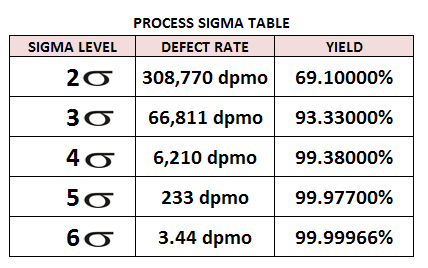
To accomplish a Six Sigma level, a production process must generate less than 3.44 defects per 1,000,000 opportunities, as shown in the table below:

The Six Sigma Levels and their corresponding defects
To identify if the capability of the process is relative to the specifications of that process, Process Sigma rating should be computed. To compute for the process sigma rating, we have to determine the total number of defects, total number of opportunities, and defect rate.
How to calculate it yourself… the simple explanation
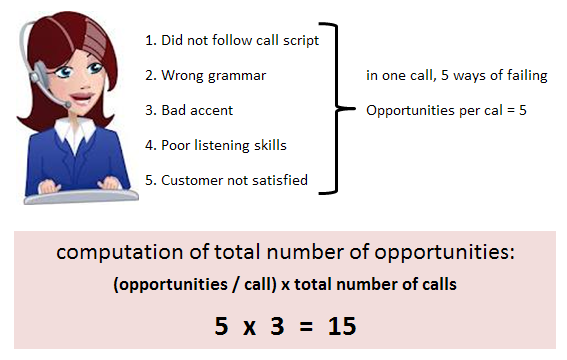
A defect is anything outside of customer’s requirement. An opportunity on the other hand is the total number of the probability for a failing. Based on the Process Sigma Table, Six Sigma rating should have 99.99966% yield. Yield is the percentage of products or services without defects. That is like one wrong drug prescription in twenty-five years.
To check if a BPO company is utilizing a Six Sigma process, we compute for the three main components: defect, opportunity, and defect rate.
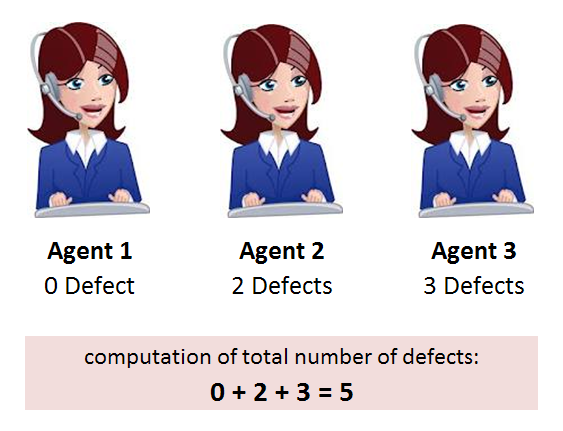
An example is shown below computes for the total number of defects:
 Illustration gives you an idea on how to compute for the total number of opportunities:
 Finally, we compute for the defect rate:
 Based on the Process Sigma table, the process being implemented by the contact center only has 2 sigma rating. This is somewhat similar to issuing 60,000 incorrect drug prescriptions in a year. Imagine the effect of low sigma rating to a business. This can end the business itself.
As a business strategy improved sigma rating results in improved process or product, reduced cost and greater customer satisfaction.
