Process capability index (Cpk) is a statistical tool, to measure the ability of a process to produce output within customer’s specification limits. In simple words, it measures producer’s capability to produce a product within customer’s tolerance range. Cpk is used to estimate how close you are to a given target and how consistent you are to around your average performance. Cpk gives you the best-case scenario for the existing process. It can also estimate future process performance, assuming performance is consistent over time.
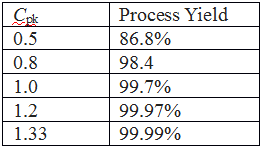
Cpk is a standard index to state the capability of one process, the higher the Cpk value the better the process is. For instance, Machine 1 has a Cpk of 1.7 and machine 2 has a Cpk of 1.1. From the Cpk value, one can derive that Machine 1 is better than 2. Since Cpk uses specification limits and parts variation (sigma), we can also arrive at the yield processed and losses from the machine.

Cpk = or >1.33 indicates that the process is capable and meets specification limits. Any value less than this may mean variation is too wide compared to the specification or the process average is away from the target.
Lets understand this with graphical representation
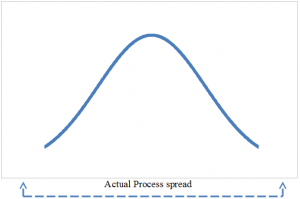
A process where almost all the measurements fall inside the specification limits is a capable process. This can be represented pictorially by the plot below:

Instance 1:
Upper specification limit (USL) =16
Lower Specification limit (LSL) = 4
Mean (μ)= 10 & Standard deviation (σ)= 2
Given the formula to calculate Cpk is
Cpk = min[USL−μ/3σ,μ−LSL/3σ]
= min[16-10/6, 10-4/6]
= min [1 , 1]
= 1
Statistical explanation when curve stretches from +3 to -3 it is believe to occupy 99.73% and here the machine is producing 99.73% good parts.

Instance 2:
Upper specification limit (USL) =18
Lower Specification limit (LSL) = 0
Standard deviation (σ)= 2
Cpk = min[USL−μ/3σ,μ−LSL/3σ]
= min[18-10/6, 10-0/6]
= min [1.33, 1.67]
= 1.33
Here atleast, 99.99% of the outputs from the machine are good.

