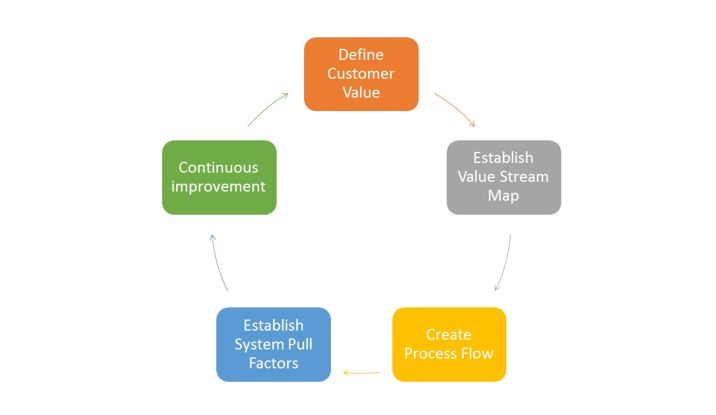
The Lean-Six Sigma methodology is a cyclic methodology that connects a manufacturing or service process to a defined Customer Value. One of the main questions that a process owner must ask themselves and their team when a customer makes a requirement is: Is my process capable of achieving my customer’s desires in a controlled and repeatable manner?
The suitable answer to this question requires the assessment of two key parameters: the Process Performance Ratio and the Process Performance Index respectively. When a customer voices an opinion (Voice of Customer), the organization has to ensure that the process can deliver this outcome (Voice of Process). The comparison of both facets of the business transaction is the process capability. The primary objective of this statistical analysis is to assess the natural variation between the actual process performance, compared to the original system design.
Process Performance Ratio:
Conducting a system capability study is a means via which process analysts can detect system defects. This article will focus on the analysis of long term system performance, in order to facilitate organizational strategic Six Sigma objectives. The long-term system process capability performance ratio is calculated by the formula:

The performance ratio assesses natural process variation and allows process analysts to determine whether the system is performing in accordance to ideal system tolerances, inherent to their design specifications. Generally, for a capable process: Pp >= 1.0. Under the Six Sigma methodology, a target Pp >= 2.0 is the standard. This requirement is based on the fact, that a simple conversion of Pp to Sigma Level requires a factor of 3 that is used as a multiplier. Utilizing the Pp is an ideal method for assessing your systems variation, but not a straight indicator of adherence to customer requirements. A good Pp means that the system defect control is ideal around a target, so let us assess how the system actually meets the customer’s needs.
Process Performance Index:
The Ppk metric is used to measure a process’ Performance Index. This is the ideal tool that a process analyst can utilize to ensure that any service provider is meeting their target quality requirements. Process variation and defect generation is well identified using this parameter. The following is the formula for Ppk.

Generally, for a capable process: Ppk >= 2.0. This parameter assesses how centered around the customer’s target, the actual performance is. Like Pp, the Ppk requirement is based on the fact, that a simple conversion of Ppk to Sigma Level requires a factor of 3 that is used as a multiplier. Once your Ppk is in an ideal range, you can rest assured that you are satisfying your customers.
Utilizing the process performance ratio and the performance index are ideal ways of assessing long term system performance. As a process is utilized, various natural shifts are expected. The factors that can influence these changes can include process feed quality shifts, equipment malfunctions, or personnel changes during a shift. Over time however, a suitable natural process average performance can be identified, which is what these two parameters aim to identify. Process analysts should expect similar numbers per shift, and per day, and if there’s a variation, corrective action should be taken to rectify the shifts.
Statistical tools such as Minitab, are well utilized in the industrial arena to analyze large amounts of process data for the desired performance ratios. Depending on your organization’s level, some departments such as process control or even the physical control laboratories, will be able to generate these numbers.
As an organization, it will be in your best interest to ensure that the voice of your customer is satisfied by the voice of your process. If not, get to work via continuous improvement, and chart a course to get yourself to your target.

