Most of us (Quality Professionals) deal with data in our day to day operations. Often, we come across situations where we have to analyze data and interpret to management about the behavior of certain groups of items. To present the data in a simple and catchy manner, we use graphical tools sometimes. There are a lot of graphs like Pie chart, Bar graph, Histogram etc. which we use for different purposes. Histogram is one such tool used to represent the frequency distribution of data falling into different groups of a population or sample.
What is a Histogram?
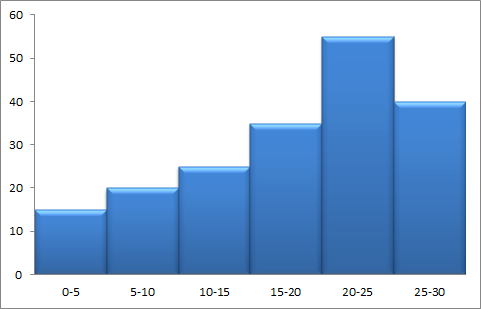
It is a graph that represents the frequency (count) of items falling into different categories of a given population or sample. It looks similar to a bar graph. It has vertical bars with different heights (Height of the bar signifying the frequency of that group). Each group has a corresponding bar representing it in the graph.
A histogram looks like below:
What are the characteristics of a Histogram?
- Histogram is used to represent categorization of Continuous data
- There is no gap between the bars unlike Bar graph, to signify that the data is continuous
- The width of the groups is equal.
Example:
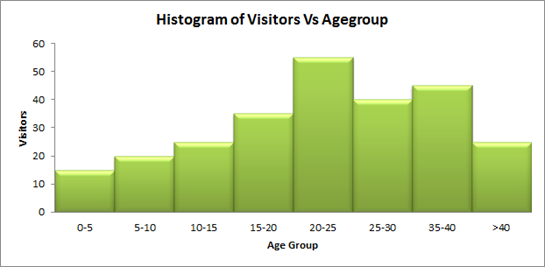
Assume the management of an amusement park wants to study the number of visitors in different age group. Based on the visitors they want to include o modify the different ‘Rides’ or ‘Theme shows’ for the maximum contributing group. They plotted a histogram to identify the frequency of visitors falling into each of the below age group.
Applications of Histogram
There are numerous places and situations where one can use a Histogram. Let us discuss about the most frequently used fields.
- In Stock exchange to identify the trade in different areas or different group of investors
- In Medical and Clinical Research, to identify the presence or absence of a condition among different categories of people.
- In photography for Image processing and digitization
- In Six Sigma, Quality improvement – to study the defect pattern across different categories of samples
Thus Histogram is an easy tool that is used in many places for its simplicity. It is also easy to understand and identify the key driver of the problem.


