Dashboard and Scorecard, both are automation tool represented graphically or as a structured report that provides “at-a-glance” information about the business performance by evaluating and measuring the crucial performance factors often termed as Key Performance Indicators (KPI) which helps management in taking important decision.
Key Performance Indicator (KPI)
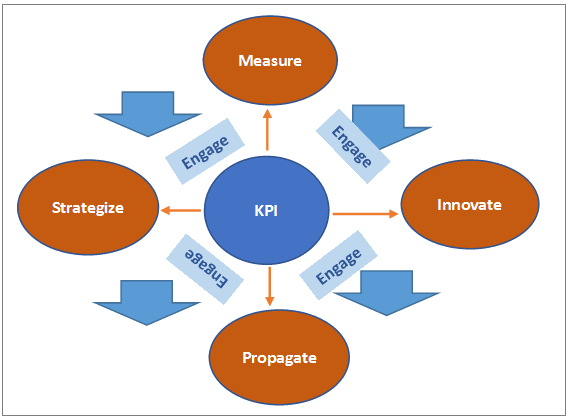
Key Performance Indicators, also termed as Key Success Indicators (KSI) are the critical performance factors that an organization keeps on monitoring to measure the progress towards organizational goals. Once an organization has defined its goals, it would require to measure certain crucial parameters to ensure that the progress is inline towards meeting the desired goals. These measurements are termed as Key Performance Indicators. These indicators also help in identifying potential areas for process improvements by following below methodology.

Figure 1: KPI Engagement
Dashboard
In Information System, dashboard is a real time user interface visual display presented graphically highlighting the most important information to achieve one or more objectives. These information are consolidated and arranged usually on a single screen so that the information can be monitored at a glance. It shows current status and trends of organization’s key performance indicators so that the decision makers can instantly track the status and make appropriate management decision in no time. Dashboard can also be stated as progress report linked to database which keeps on refreshing and publishing the real time data consistently.
A dashboard provides a graphical user interface which can easily be customized to suit the particular needs of a user.
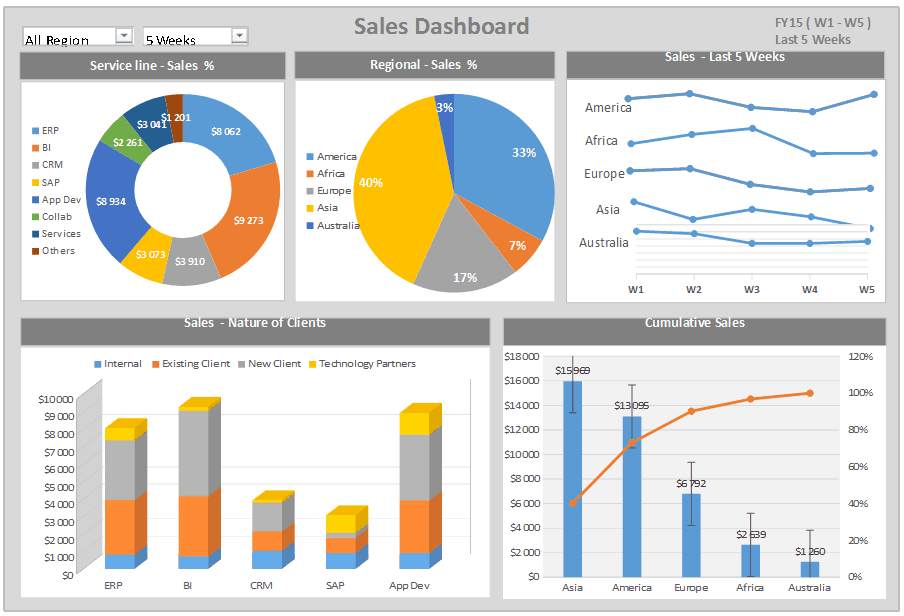
For example, a Sales dashboard may show progress related to sales, revenue or profit across geographical clusters or service lines. It helps regional sales manager to track the performance of individual sales representatives and monitor the count of deals closed on real time basis.
Digital Dashboard
Digital dashboard are the one developed using software applications linked to database, where the business units and its stakeholders are the driver of dashboards and the IT departments are the enabler or supporter.
There are basically three major types of digital dashboard often used in the market today.
- Standalone software applications
- Web-browser based applications
- Desktop applications also known as Desktop widgets driven by widget engine.
Figure 2: Sales Dashboard
Scorecard
Scorecards provide visual presentation of standard key performance indicators (KPIs) that help businesses measure and manage performance. The very purpose is to keep the business focused on a common strategic plan by monitoring real world execution and mapping the results of that execution back to a specific strategy. It is used to align operational execution with business strategy. The most common scorecard used in every business is Balance Scorecard.
Balanced scorecard
It is strategically designed performance management tool or a standard structured report that can be used by supervisor to keep a track of current activities performed by their staff within their control and also monitor the consequences of these actions.
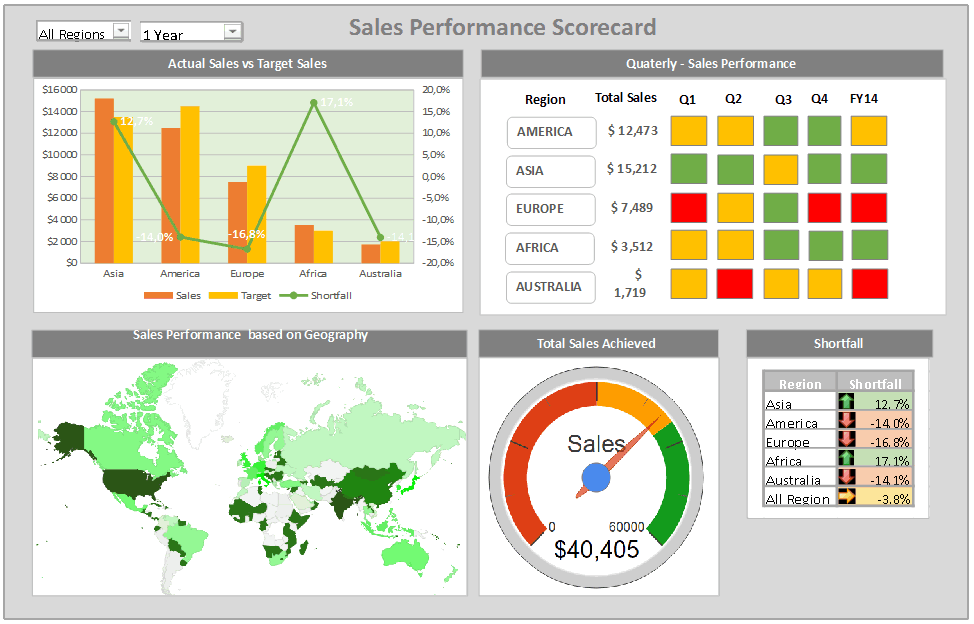
For example, a Sales performance scorecard may show performance related to sales, revenue and profit against target or budget estimates. It may also highlight the shortfalls or deviations in actual figures against the estimated targets.

Figure 3: Sales Performance Scorecard
Difference Between dashboard and Scorecard
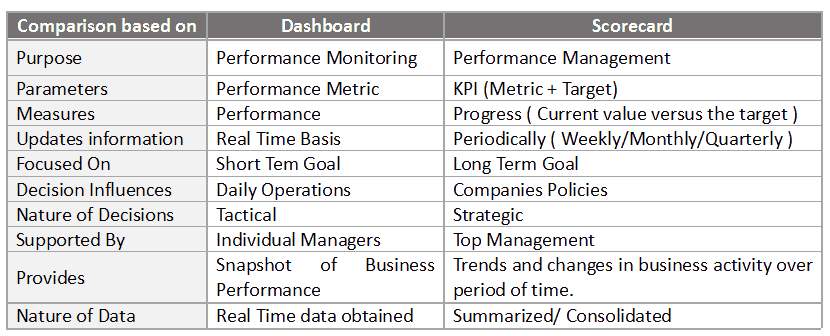
A major difference between the dashboards and scorecards is that a scorecard focuses on a given metric and compares it to a forecast or target, whereas a dashboard will present multiple numbers in different ways.
In short, a dashboard is a performance monitoring system, whereas a scorecard is a performance management system.

Table 1: Dashboard vs Scorecard

