
I. Short Version
CoPQ stands for ‘Cost of Poor Quality’. It is a measure that specifies the importance of poor quality in terms of monetary value. It is always measured and tracked in terms of money ($ or £, whatever be the underlying currency)
Monitoring and tracking Cost of Poor Quality in a defined and standardized manner across the organization and benchmarking the Cost of Poor Quality values within the department or against a competitive or market leader, helps the organization to gage its performance and set an appropriate target to work on. Dissecting and deep-diving on the CoPQ values will provide an idea of where the pain area lies with in a process or in which department/function.
Nowadays there are multiple software and ERP packages available to integrate inputs for CoPQ calculation from linked processes, to calculate and publish CoPQ and integrate it with business results. Thus it is simple and easy to measure and use CoPQ productively.
How is CoPQ calculated?
Technically, it is the cost incurred by the organization/function as a result of producing defective units/products. Chances are that the defect could have been identified either internally within the organization, or externally by the customer.
Therefore:
Cost of Poor Quality = Internal Failure Cost + External Failure Cost
Let us understand these two terminologies one by one.
Internal Failure cost could be cost incurred as a result of rework, additional raw material procurement, over-time cost for employees to keep up with the delivery schedule, scrap cost and so on. The components vary based on the nature of business.
External Failure costs are warranty and penalty costs, replacement costs, Product recall costs, Transportation of return stock and exchange goods, sales lost due to stock unavailability etc.
And more importantly, an intangible loss is the loss of reputation in the eyes of customer and the related loss of market share and customer loyalty. Thus, many organizations have started to identify the correlation between CoPQ and Customer retention rate.
II. Detailed Version
1. Quality is Free
Before discussing the Cost of Quality (COQ) or indeed the Cost of Poor Quality (COPQ), we must first understand the origin of the term. Phil Crosby, one of the fathers of quality spoke of and called his book ‘Quality is Free’. He famously said “Do things right in the first place, and you won’t have to pay to fix them or do them over”.
Crosby found that many organizations possess quality-related costs as high as 20 percent of turnover, with some creeping as high as 40 percent of total costs. Crosby estimated that that cost of poor quality in a prosperous company will be about 10 to 15 percent.
This is where the concept of COQ and COPQ was born.
2. Cost of Quality Vs Cost of Poor Quality – What’s the difference?
The fundamental concept of Quality is to produce a product or service that satisfies customer requirements.
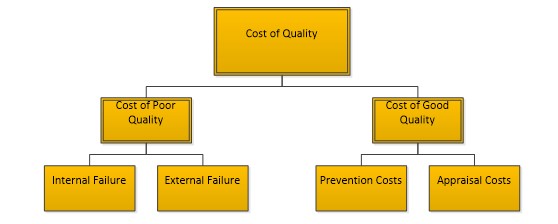
As shown above, COPQ and COQ can be broken down further both comprising of two elements.
Cost of Quality
- Prevention Cost – These costs used to prevent a quality problem from occurring initially. Typical costs that are included in this category are; employee training, competency management, machine maintenance, certification costs, and process or equipment automation.
- Appraisal – Any activity related to inspection of the product or service falls in this category. Typical costs included would be; Calibration and inspection staff.
Cost of Poor Quality
- Internal Failure – Internal Failure are costs related with recognizing a non-conformance exists prior to the product reaching the customer. The most common cost in this category is scrap due to scratches; aesthetic damages etc., followed by rework costs.
-
External Failure – This is the most severe failure. This is failure of a product or service at the delivery point or usage point of the customer or user. There are two reasons why this failure is so severe. One, the product has had its full value added by the manufacturer, including transportation and storage costs.
Secondly, reputation in effected. The customer experienced the failure, and depending on the severity of the failure, this could greatly damage the organizational reputation and subsequently hinder future business. This is especially costly and damaging in the event of providing product to safety critical applications such as aerospace, medical, pharmaceutical or automotive. An example of this is covered later in this article.
The 1-10-100 Rule
The 1-10-100 rule is a quality management concept used to quantify the hidden costs of poor quality. This is a conceptualization model to provide a rough idea of the cost increase as quality issues arise further throughout the product lifecycle. In the illustration below it is attempted to show that one unit spent on prevention will save 10 units on correction and 100 units on failure costs. As the product moves along the streams of events from design to dispatch the failure costs become greater.
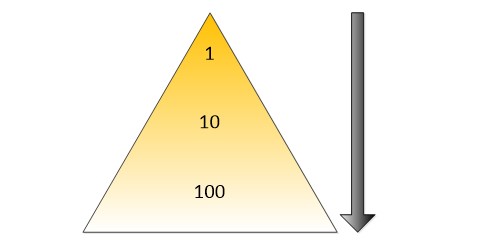 Again, similar to Crosby, this is based upon the consideration that savings created by reduction of hidden costs can offset the costs incurred to create the proper environment.
Takata
Takata, a worldwide manufacturer and supplier of airbags agreed to plead guilty and pay $1 billion in damages to settle criminal charges that it knowingly sold millions of defective airbags to automakers. The gas used to inflate the airbags was inexpensive relative to what other suppliers used; however, it was much more volatile and caused premature deployment at a rate of excessive explosiveness that sent shards of metal at the victims. At least 20 people have died worldwide and more than 280 have been hurt. An estimated 70 million Takata airbags have been installed in 42 million cars worldwide.
This is a severe example of external failure cost due to bad planning within the organization, and emphasizes the huge financial, reputational and political costs that can be accrued in such instances. Takata has now subsequently filed as bankrupt.
Total Cost of Quality
The graph below details Total Cost of Quality, a financial model of the costs incurred to operate and maintain the function of quality in a business. This is also known as The Economic Conformance Model. The model considers all of the activities that any company would perform in the name of providing quality products or services to customers. It shows the increasing costs linked with proactive quality management compared to the decreasing costs associated with improving quality.
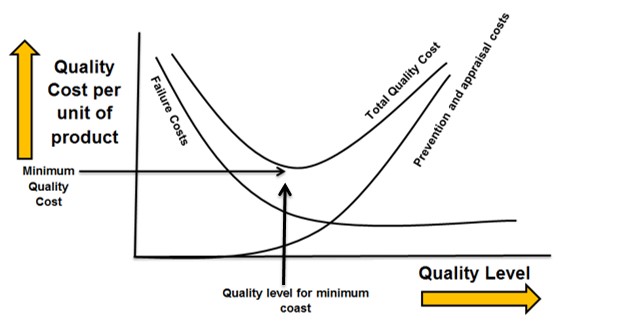 The total cost of quality is represented by a parabola. The low point of curve is called the economic conformance point. This point represents the lowest possible cost of quality that a company can expect to see for the lowest cost without causing non-conformance. This aim is to create a balance between the costs associated with preventing a problem from occurring and the costs of dealing with the problems that do occur.
3. Summary
Philip Crosby demonstrated how powerful COQ could be to raise awareness of the importance of quality and get it discussed in the boardroom. He referred to the measure as the “cost of nonconformance” and created the idea that organizations make a conscious choice to pay for poor quality if they do not optimize their management system.
The quality system should be dynamic and impact the achievement of the organization’s mission, goals, and objectives through effective quality management. This provides a method of assessing the effectiveness of the system and a method of identifying problem areas, opportunities for cost reduction and therefore prioritization. Once implemented, a quality management system that identifies and eliminates COPQ can be used as a strategic weapon to improve organizational efficiency and effectiveness.