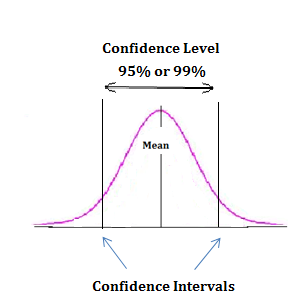
Most of us would have used these terms and values in our statistical analysis and estimation. They sound similar and thus are also confusing when used in practice. While the purpose of these two are invariably the same, there is a minor and important difference between these two terms conceptually, which makes them to inevitably devote an article to them.
Both confidence interval and Confidence level go together hand in hand. They are used in estimating any data with a certain level of accuracy. To explain simply, when a dice is thrown at random the chance of getting ‘3’ in 50 throws varies. In an experiment, an athlete runs and his average performance varies. Say, mostly his performance lies in the range of 21 seconds to 25 seconds. This term ‘Mostly’ is very subjective. For some it might be 99% of the times, and for some other it may be 80% of the times and so on. Therefore to statistically state the range of an estimated/predicted value: the term confidence level is used.
It is the probability that the population parameter value lies between a specified ‘Range’. This specified range (21s to 25s) is the Confidence Interval. Confidence interval is always expressed in percentage and most of the statistical calculations use a value of 95% or 99%, depending upon the accuracy of data needed.

Confidence interval is always in the same unit as the population parameter or sample statistic. Confidence interval is generated/calculated using the confidence level required by the user with the help of z table/t table/chi-square table based on the distribution.
Confidence Intervals are mostly used in hypothesis testing to validate an assumption and in methods like correlation, regression etc, to arrive at intervals for the required confidence level.
