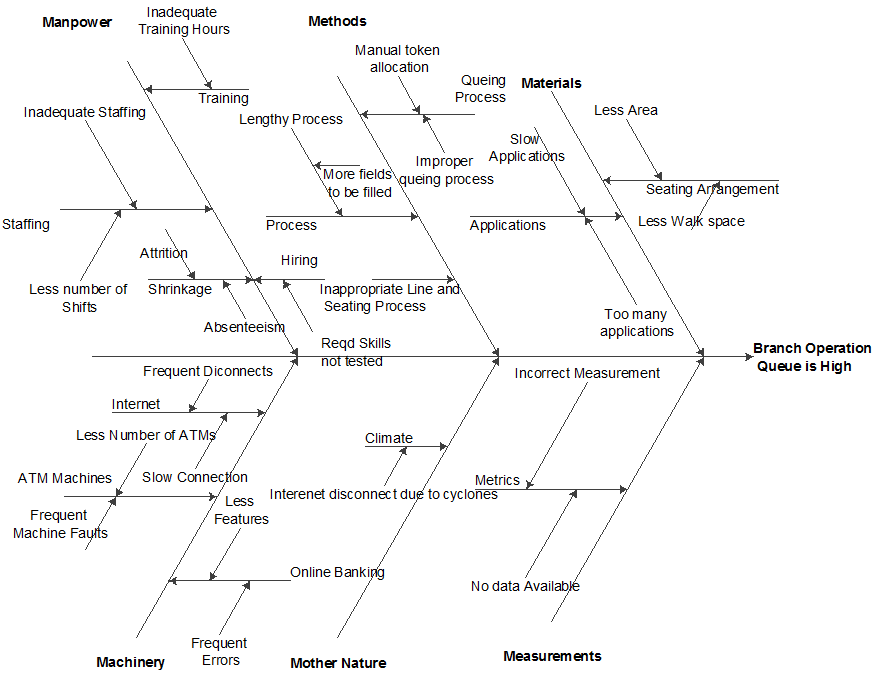
Ishikawa Diagram otherwise known as Fishbone diagram is one of the tools most commonly used by Quality Professionals. The purpose of this tool is to list down ALL the potential root causes leading to a problem. Thus it is one of the important tools used for problem solving methods like DMAIC, PDCA, and many other projects. Other than that, Ishikawa diagram is also used in New Product Development for identifying all the potential features. It is also called a “Cause and Effect” diagram, because it lists down all the potential causes for a given effect.
As the name indicates, this tool was developed by Prof. Karou Ishikawa. He first listed down all potential design features to be available in a product under different headers. It is also considered as one of the Seven Tools of Quality. Fishbone diagram looks like the skeleton of a fish. It has six main branches: Men, Material, Method, Machine, Measurement, and Mother Nature. Al the potential causes that might impact the problem are listed under these main causes. User can branch out sub causes till the level he feels that is relevant to the problem.
How to create an Ishikawa Diagram?
- Identify the problem area and define the problem clearly.
- Team up all the relevant members who are knowledgeable in the problem under study.
- Write the Six main categories on the board.
- Brainstorm all the possible causes and sub causes that impact the problem.
- List down all the identified causes into any of the six categories.
- Branch out for necessary sub causes under the main causes, if necessary.
Let us illustrate this with an example. Assume a famous bank, having branches in few parts of the city. One of the branches located in the main part of the city has high a very high queue to manage during most of its operating time. The bank’s management wants to understand the reasons for the high queue and reduce the queue so that it can serve more number of customers and also reduce the waiting time of its customers.
The Quality team was called and asked to solve the problem. A core team was formed and they started to work on the problem. They first started off with drawing a Cause and Effect diagram. The diagram looks like below:
After arriving at the CE diagram, the next step is to collect the number of occurrences of each of the cause. Then the team shall focus on the most frequently occurring causes using Pareto diagram or a Pie chart.
The main advantage of Fishbone diagram is, it helps us to bring a holistic view of the problem. Thus it serves as a great tool in progressing towards the root cause identification. And it is one of the easiest tools to use because of its simplicity.

