Collecting and analyzing data forms a major part in a Six Sigma project or any other continuous improvement initiative. All of the stakeholders in a Project, right from Champions to Yellow belt members must be aware of the basic Statistics used. Though the Green belt and Black belt members will own the responsibility of analysis, knowledge of the basic statistics is necessary to identify the type of data, to collect the data in the right format, and various other requirements. What should they know?
You should know about:
- Types of Data: What types of data exist actually and how to identify the type of data
- Descriptive Statistics: What measures describe the property or nature of the data being collected
- Normal distribution: Most of the statistical tools and analysis are developed for Normal distribution. If the underlying data is not normal, then the data is transformed into normal with the help of some tools.
Types of Data
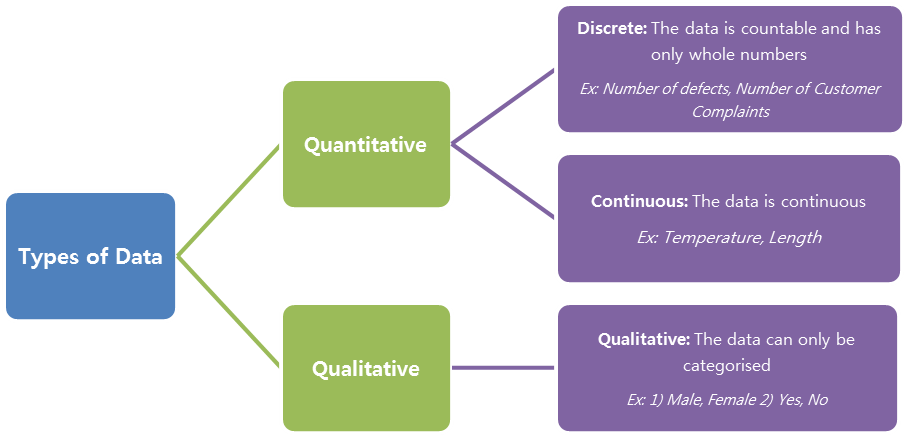
There are two broad categories of data: Qualitative and Quantitative data. The name itself indicates that the former cannot be quantified in numbers whereas the later can be.
The below tree will explain the types of data simply and clearly:
Descriptive Statistics
As most of the data that we use are continuous, let us learn about how the data can be studied and interpreted.
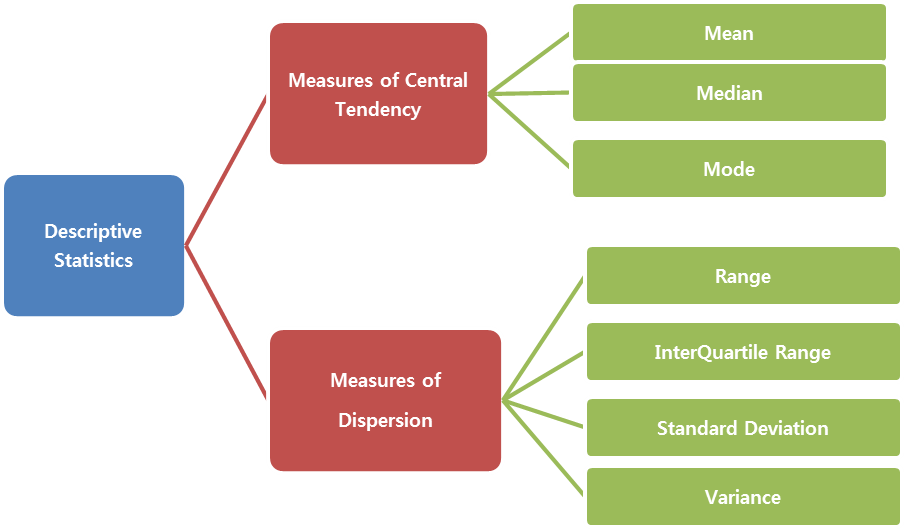
A population or sample can be represented in two ways: i) Measures of Central Tendency ii) Measures of Dispersion.
A distribution can be best described by the above two measures: how good are the data points lying around the central value and how are they spread around this central point. Thus measures of central tendency finds out the central point of the data and measures of dispersion try to find the spread of the data.
Measures of Central Tendency
a. Mean: It is the arithmetic average of all values:
Mean = Sum of all values /Total number of values
b. Median: It is the central value of the data points, when arranged in ascending or descending order:
Mean = (n+1)/2th value
c. Mode: It is the most frequently occurring value in the data set.
Based on the nature of data, any one of these is used.
Measures of Dispersion
a. Range: It represents the gap between the highest and lowest value in the group.
Range = Maximum value – Minimum Value
b. Inter-Quartile Range: It represents the gap between the mid 50% values, when the data is arranged in ascending order. The data can be divided into four quartiles.
First quartile value = (n+1)/4th value
Third Quartile Value = 3(n+1)4th value
Second Quartile Value = 2(n+1)/4th value = (n+1)/2th value, which is the Median value
IQR = Third Quartile Value – first Quartile Value
c. Standard Deviation (σ): It represents the deviation of all the data points around the mean (µ).
d. Variance: Variance is the squared value of standard deviation. It magnifies the deviation value and thus is used in fields where even a small variation is very critical.
Thus, the entire population or data set can be described by these two parameters. They form the preliminary observation of any data before proceeding to choose further analysis.
Normal Distribution
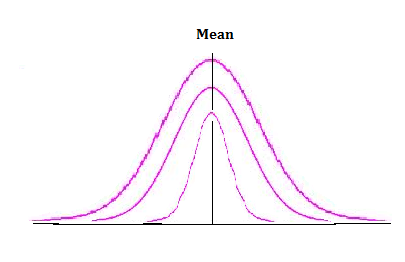
Any population has numerous data points spread in different ranges. There are a lot of distributions that exist when they are plotted in a frequency plot. Normal distribution is one of them and the most frequently used one also. A Normal Distribution can be characterised by two values: Mean and Standard deviation. The Normal distribution looks like a bell shaped curve. The peak central value represents the mean and the tapered ends represent the maximum and minimum values. The size of standard deviation determines the width of the curve. Higher is the SD, the curve looks broad. Lower the SD, the narrow is the curve, for the same Mean.
 The above diagram explains how the data points are spread differently for the same mean and different standard deviations.
The entire concept of Six Sigma (99.9997% of values falling within six standard deviations), Control charts, Process Variation reduction, and many others revolve around this Normal curve. Thus it becomes very much necessary to understand the normal distribution.
Knowing the types of data, how to represent the data in descriptive statistics and Normal distribution lay the foundation for Statistical data analysis.


